How to Read Histograms

Is your image too dark or too bright? Your histogram will let you know.

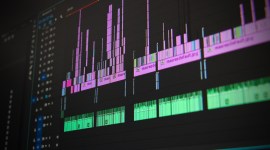
If you taking pictures or video you probably have at least seen a histogram. Simply put, histograms are a visual representations of the tonality of your image. White pixels on the right, black pixels on the left and mid-tones…well you get the idea.

Practically speaking a histogram will tell you if an image is underexposed or overexposed. The goal is to create a hump in the middle with the falloff not touching the left or right side of the image. The following video will give a quick rundown on how histograms work and how you can use them to become a better photographer/filmmaker. The video covers:
- Reading Histograms
- Setting Up Histograms
- Understanding the Layout
This video was first shared by CreativeLive on their YouTube channel. If you are interested in learning about other exposure/color scopes we recommend checking out our post on Vectorscopes and Waveforms.
Have any recommendations for working with histograms? Share in the comments below.