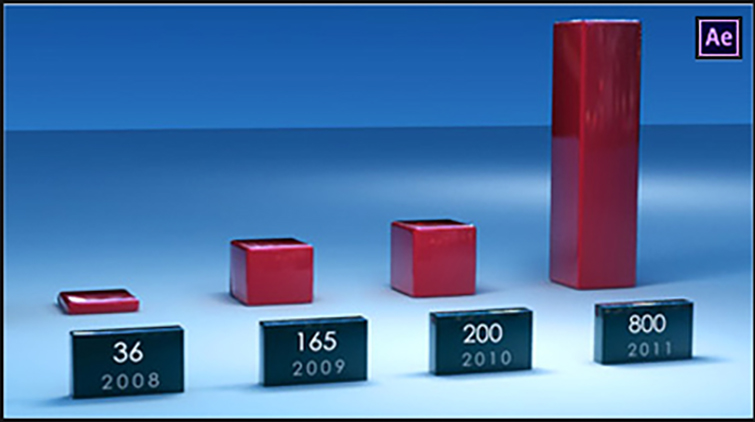
Video Tutorials: Charts and Graphs in Adobe After Effects
If your video project calls for a pie chart or graph, use one of these tutorials to learn how to create dynamic charts and graphs in After Effects!
Charts and graphs aren’t sexy, but using infographics is often the best way to display a data set. It’s common for corporate and business videos to utilize charts and graphs, so it often falls on the After Effects editor/designer to show off this data in a visually compelling way.
In the following video tutorials, you’ll see how to create pie charts and bar graphs using tools in After Effects.
PremiumBeat blogger and skilled motion designer Evan Abrams shows you how to create a pie chart in After Effects that dynamically animates on and off.
Andrew Kramer from Video Copilot shares his recipe for creating bar graphs in After Effects. Although this tutorial is a few years old, it’s still highly relevant and full of useful info. Click the image below to view the tutorial and download the AE project file.
Rob Mize did a two-part series for Creative Cow in which he demonstrates how to create create masks and expressions to generate and animate line graphs, area graphs, bar graphs, and pie charts in After Effects.
Don’t have the time or energy to make charts and graphs in After Effects from scratch? You can download an After Effects charts and graphs template from FluxVFX for $35.
Be sure to check out PremiumBeat’s After Effects archive for plenty of additional motion design tips, tricks, and techniques!


